It’s that time of the year. Many B2B companies are deep in their 2020 marketing planning cycle. Demand gen leaders at both mid-to-large enterprises, and high growth B2B SaaS startups, are seeking smarter ways to deploy their program budgets. They want minimal risk, clear visibility, and maximum positive impact on their pipeline, as they evaluate new program options to reach and engage their hard-to-reach senior buyers at target accounts.
 Did you know that Account-based (ABM) advertising is arguably the second most cost-effective way for you to spend your 2020 program budget (after nurture emails sent from your marketing automation platform) to reach and engage exactly the right buyers at your target accounts.
Here, explained in this post and live for you to test out in our Interactive Modeler, is a simple model that shows how just a $35,000 quarterly spend (or $140,000 annual spend) in ABM advertising, when deployed alongside a few other key marketing programs (marketing emails, site retargeting, and account-level insights off your website) can drive over $7 million in qualified pipeline for you in 2020.
Our pipeline impact model assumes that you are able to track the buyer behavior of both known and anonymous buyers from your target accounts. The buyer behavior data captured in your marketing automation (MAP), CRM, and ABM advertising platforms can feed into an account scoring model. If you have not done so, we recommend implementing account scoring as an extension / add-on to your current lead-based scoring models.
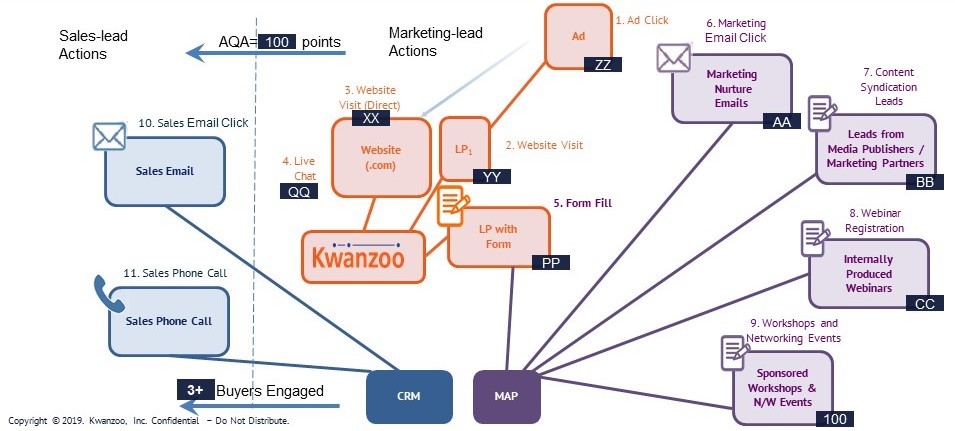
Our model assumes that you deploy your ABM process for engaging your target accounts across multiple digital channels as shown in the visual below. As you engage accounts, and meet certain engagement thresholds, you would prioritize and push the account over from Marketing to Sales as an Automatically Qualified Account (AQA).
Step 1: Defining key metrics for generating your AQAs
What is an AQA? An automatically qualified account (AQA) is an account that has engaged with your company across multiple online and offline channels. You would assign points to each buyer’s behavior, with the goal of converting an account that shows deep-engagement and meets certain qualification criteria into a sales opportunity.
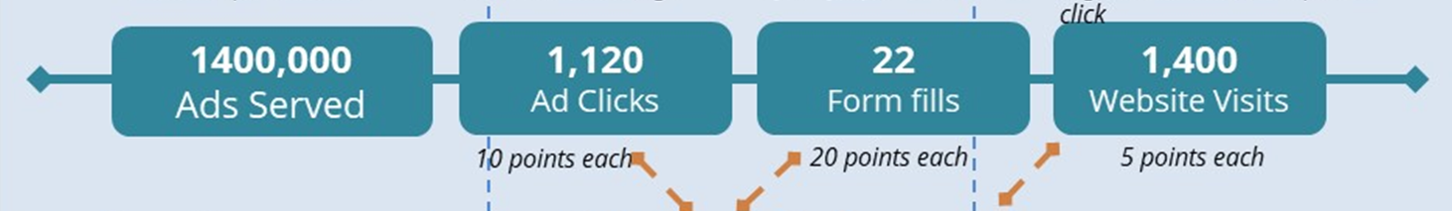
In our example below, we will assume that AcmeCorp chose the threshold of 100 points for reaching an AQA status for any of their target accounts. Each individual buyer action was worth a certain number of points: for instance, each buyer’s click on an ad was worth 10 points, form fills were worth 30 points each, and unique website visits were worth 5 points each. Then, as buyers at each account interacted with the client’s website around a specific product or solution, the account’s total score increased until at 100 the account was moved to an AQA status and pushed to sales.
The relative values of different interactions, and the number of buyer engagements needed for a company to reach an AQA, can vary from company to company so this type of value assignment exercise is crucial to putting an effective ROI and pipeline impact model in place.
Step 2: Defining baseline metrics from your ABM ad programs
It goes without saying that knowing which accounts you want to target is essential to planning an effective ABM advertising program. Map out your target account list, and sum up the total number of accounts you will be targeting. Then using industry benchmarks, you can forecast the number of ads, ad clicks, website interactions and more that you can expect to see from your ABM ad programs. In this example, AcmeCorp started with a standard list of 350 target accounts, that were targeted with 1.4MM ads served over the quarter (at an average of 4000 ads served into each account).
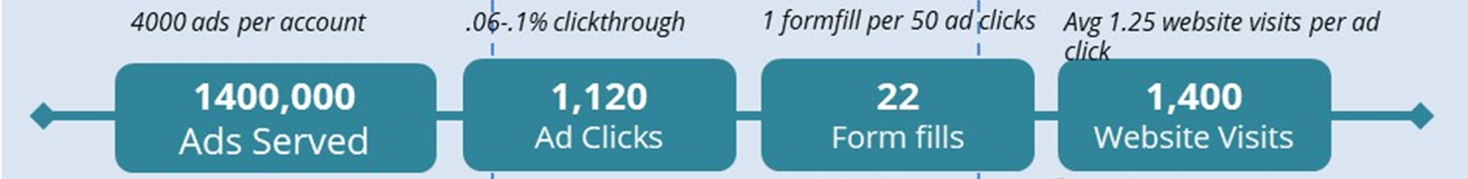
We have used typical baseline data for ABM ad click engagement, form fills on landing pages, and website visits from ABM ads to model the number of ad-driven buyer interactions that you can conservatively expect to see from your own ABM ad programs.
Step 3: Assessing the potential number of AQAs
You can use the raw baseline data above on buyer engagement that you can expect, which will of course scale based on your ABM Ad volume and the size of your Account List. Using the model, you can forecast your expected number of AQAs (low, average and high) from your ABM display programs, by summing up the total points generated and then dividing this by your AQA point threshold (in our example for AcmeCorp, this comes out to 25,860 points divided by 100, or 258 AQAs!) 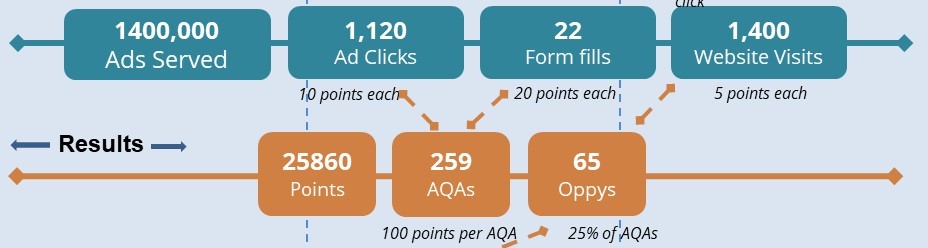
Step 4: Turning AQAs into Opportunities and Pipeline
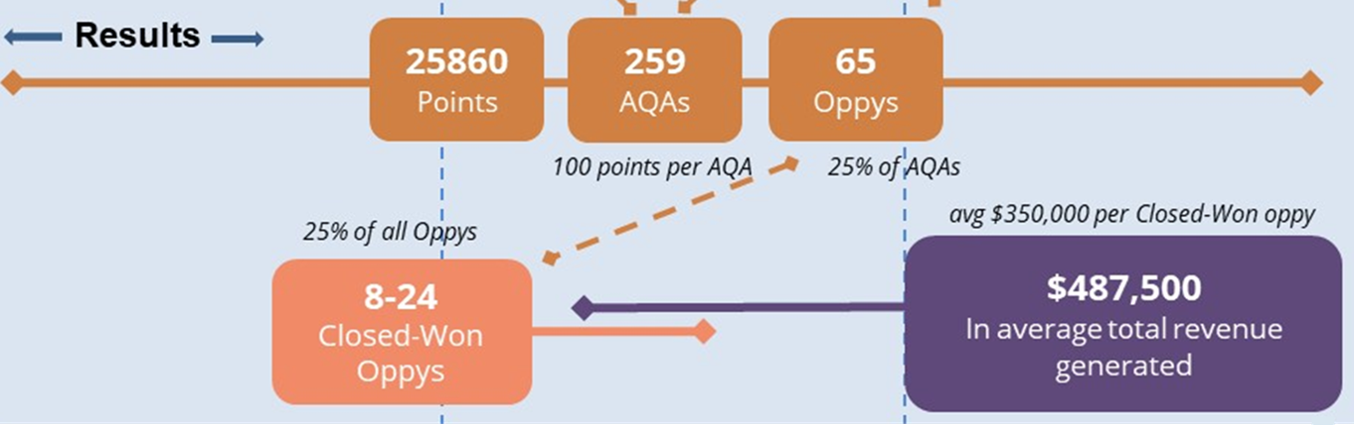
Finally, you can review historical conversion rates from when Sales starts engaging a set of accounts, to the number of accounts that turn into an opportunity. You will want to define conversion rates from AQA to opportunity and opportunity to Closed/Won. By setting these values into our model, you can forecast both the number of Opportunities and opportunity pipeline generated by your ABM Ad programs! In the example below for AcmeCorp, we have assumed a 25% conversion rate at the AQA and Opportunity stages, and a Closed/Won deal value of $30,000. Our model shows a total of 65 opportunities, that generate over $1.71MM in the pipeline, with a forecasted average of $487K in revenue from $35K in ABM ad program spend.
As your ACV goes up (say from $30K ACV to $75K to $100K ACV) you will see an even larger pipeline impact from ABM ad programs. There is simply no easier or more cost-effective way to reach your hard-to-reach senior buyers!
We hope this simple way of modeling the ROI and pipeline impact of ABM ad programs makes sense to you, and is easy for you to explain to your management, as you ask for budget and finalize your marketing programs for 2020. Feel free to play around and build out your own use case in our Interactive Modeler, or contact us to learn more. We would welcome your questions, comments and thoughts.